Given an example application:
<html>
    <head></head>
    <body>
        <script>
            // Standard logging
            console.log('This is a console log');
            console.warn('This is a console warn');
            console.info('This is a console info');
            console.error('This is a console error');

            // Logging an object (Must be JSON serializable)
            const myObj = {name: 'hello', arr: [1, 2, 3]};
            console.log(JSON.stringify(myObj))
        </script>
    </body>
</html>
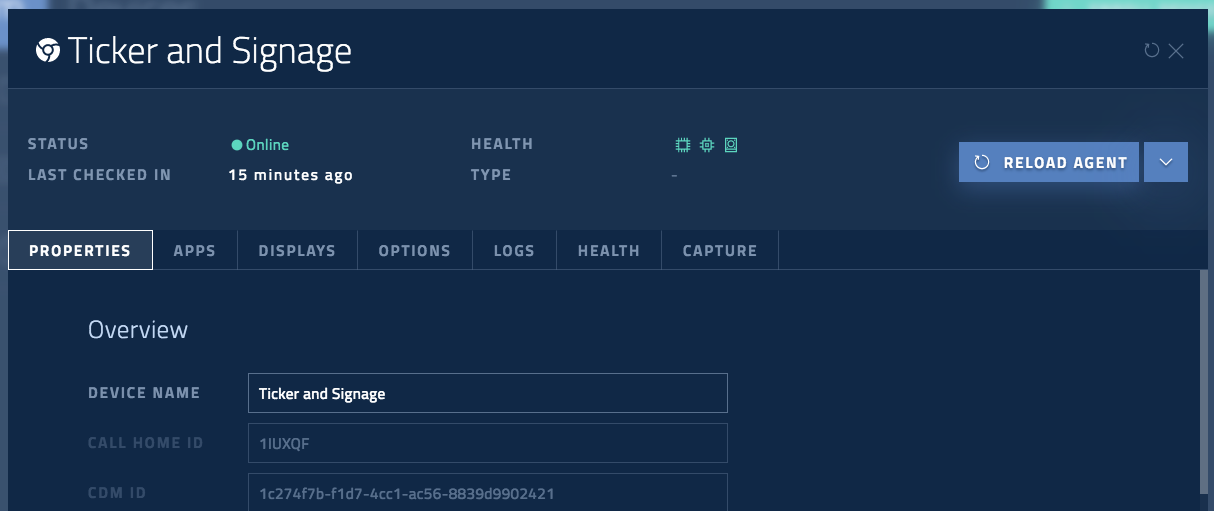
Using MeldCX Dashboard:
We can log in to the MeldCX Dashboard:
-
Open your device
-
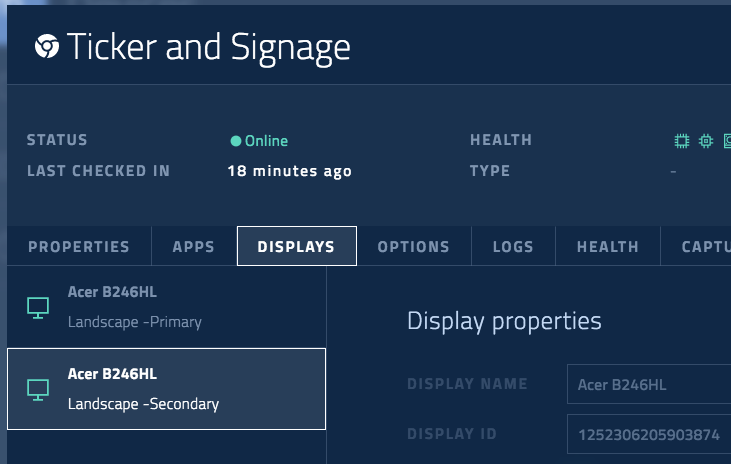
Navigate to displays
-
Identify the display your app is running on

-
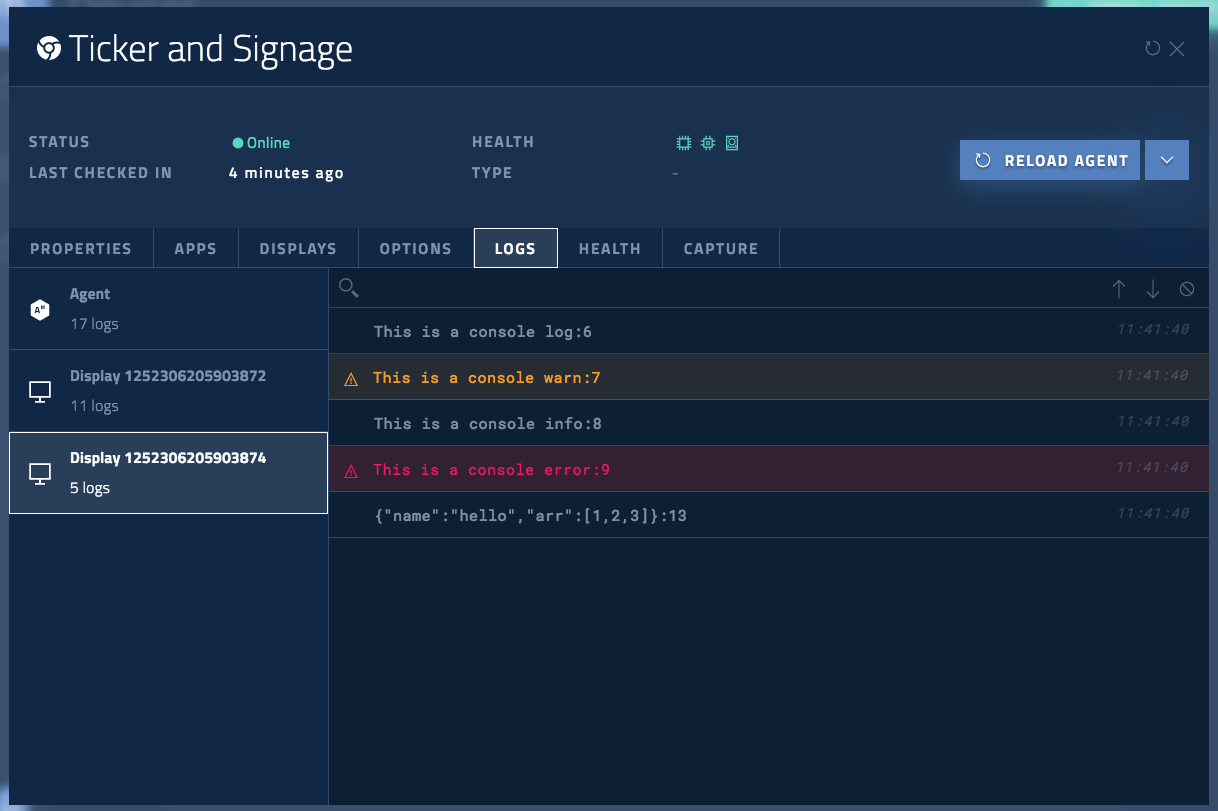
Click on the logs tab
-
Wait for the websocket to connect
-
Select the display your app is running on
-
If no logs appear, switch to the health tab

-
Select clear cache

-
Return to the logs tab
Using Vorlon.JS
Alternative you may choose to use Vorlon JS. Vorlon JS is a powerful remote web app testing utility, it can be found here: VorlonJS